How organizations actually deploy, fill, and maintain their screens in 2026 — benchmarks from real-world screen telemetry and a survey of 515 respondents.
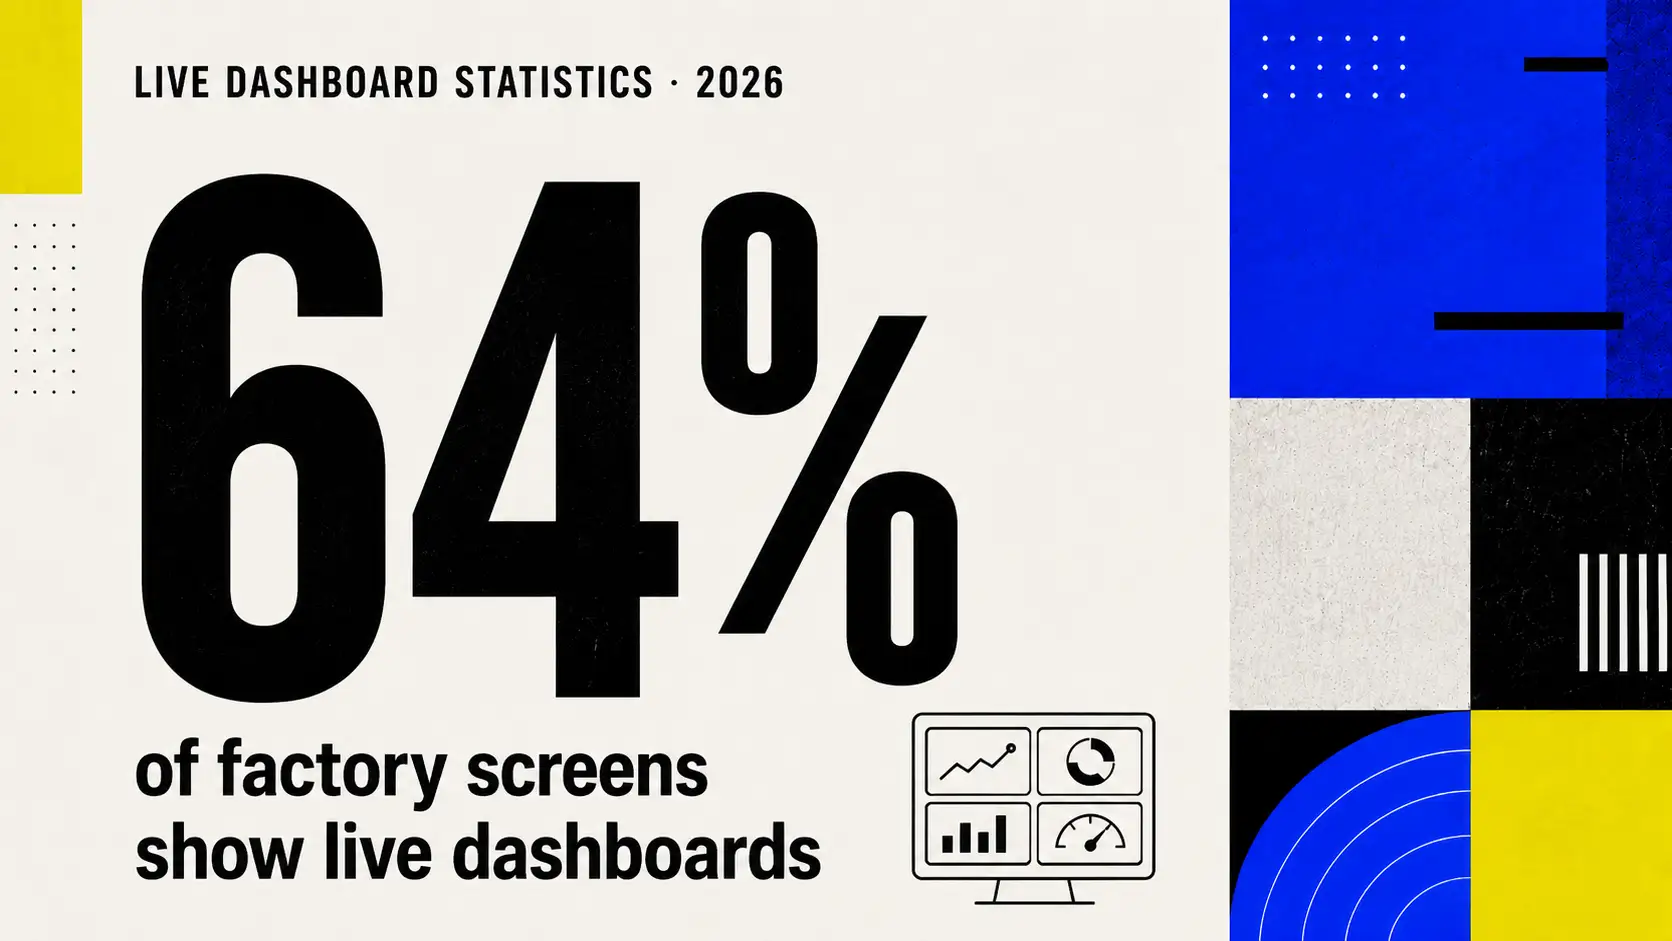
Dashboards on 64% of factory screens, social near zero. Production-floor benchmarks.
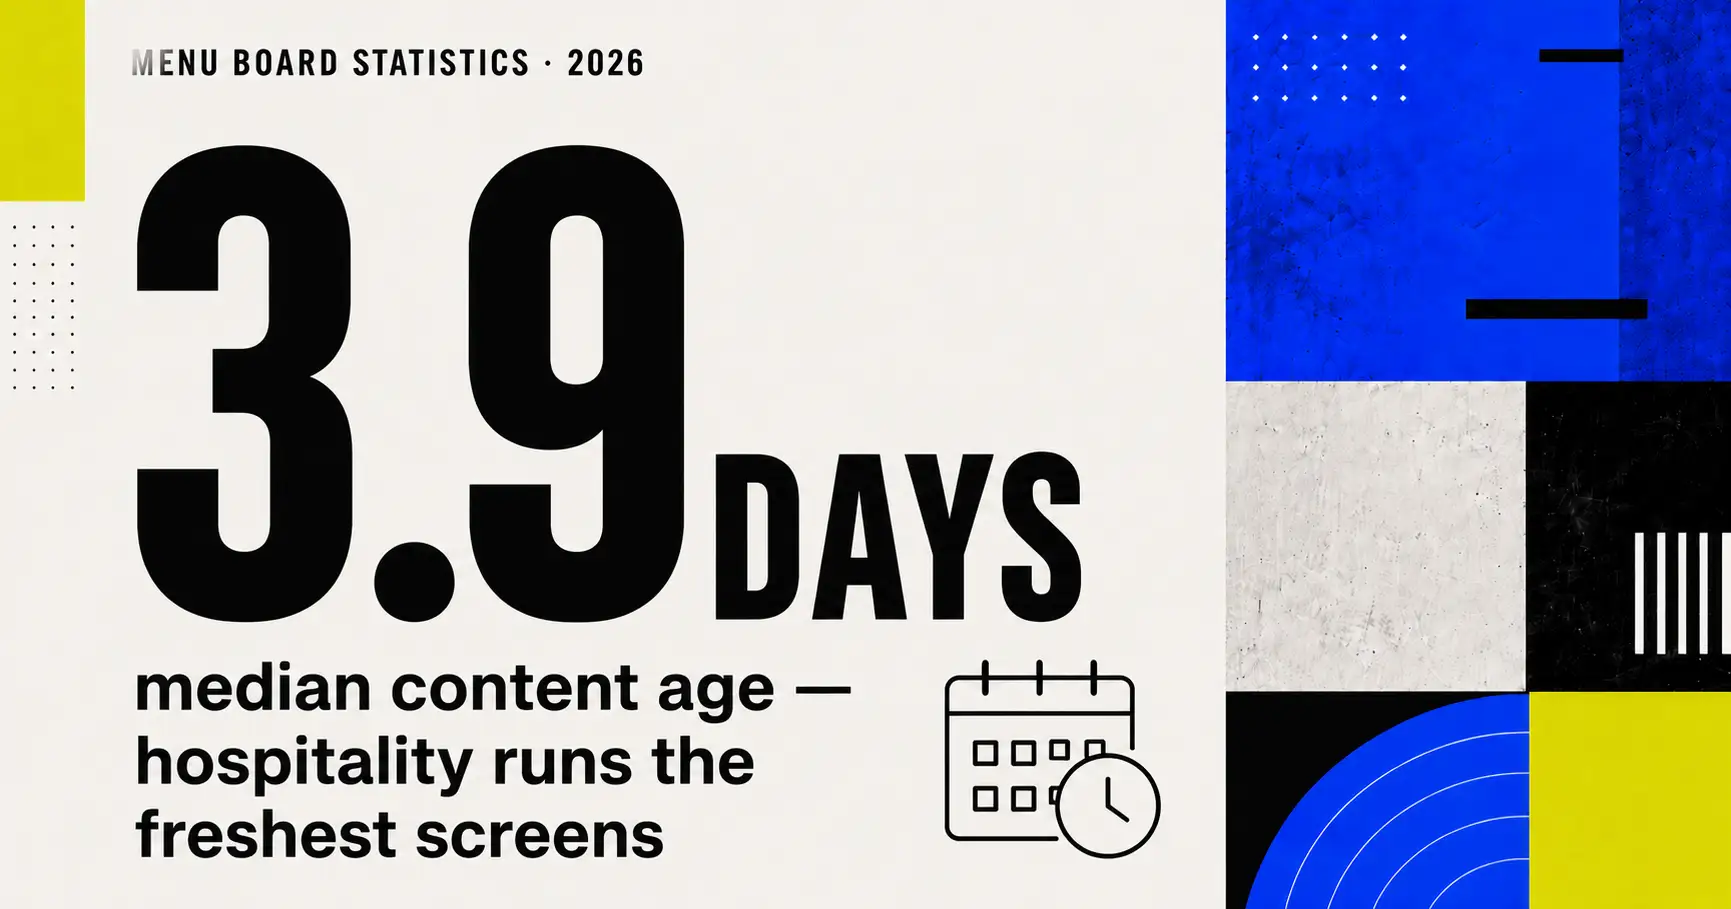
Hotels run the freshest signage of any industry — content updated every ~4 days.
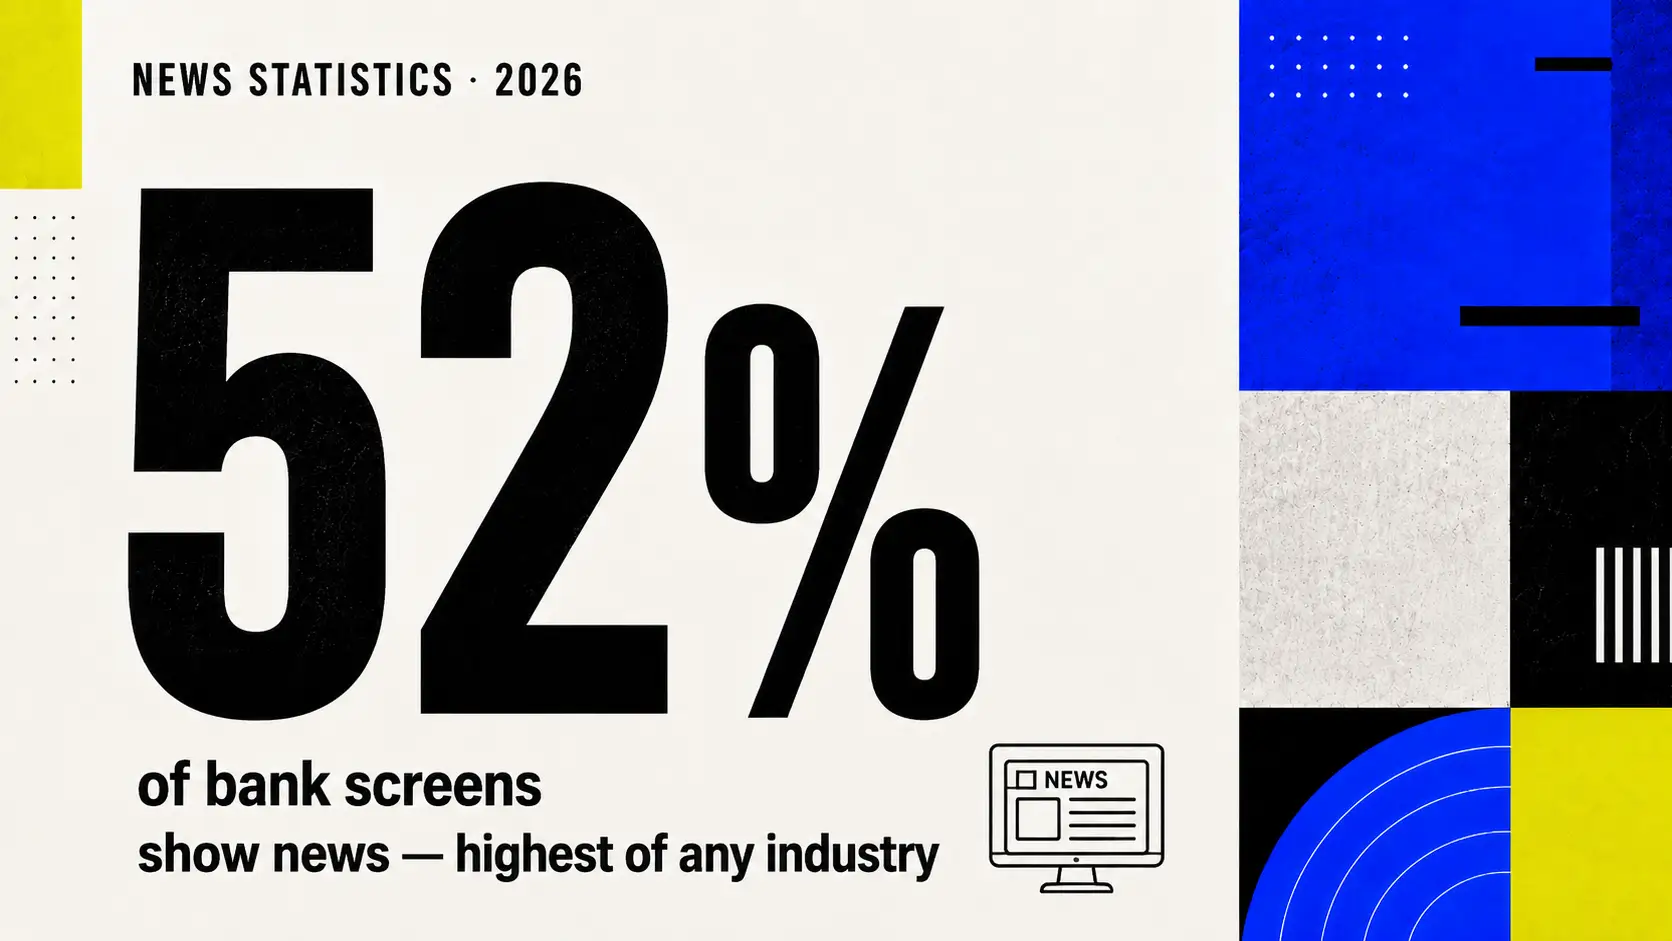
News on 52% of bank screens — the highest of any industry. Branch benchmarks, measured.
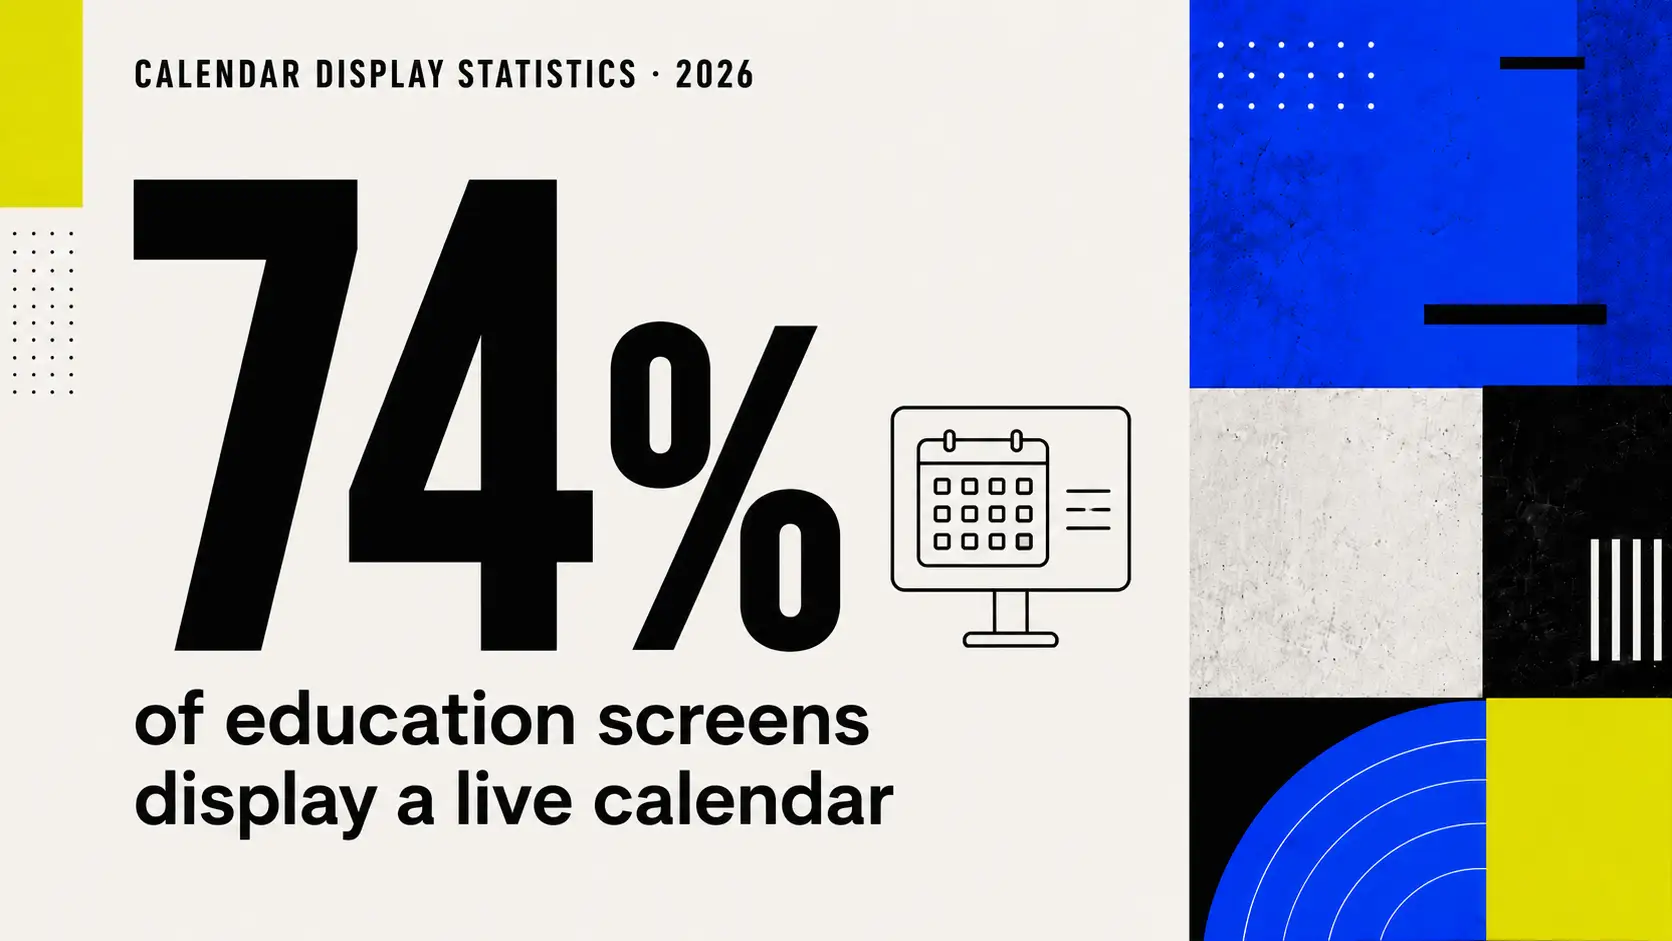
94% of school screens show weather, 74% calendars — and the slowest refresh of any vertical.
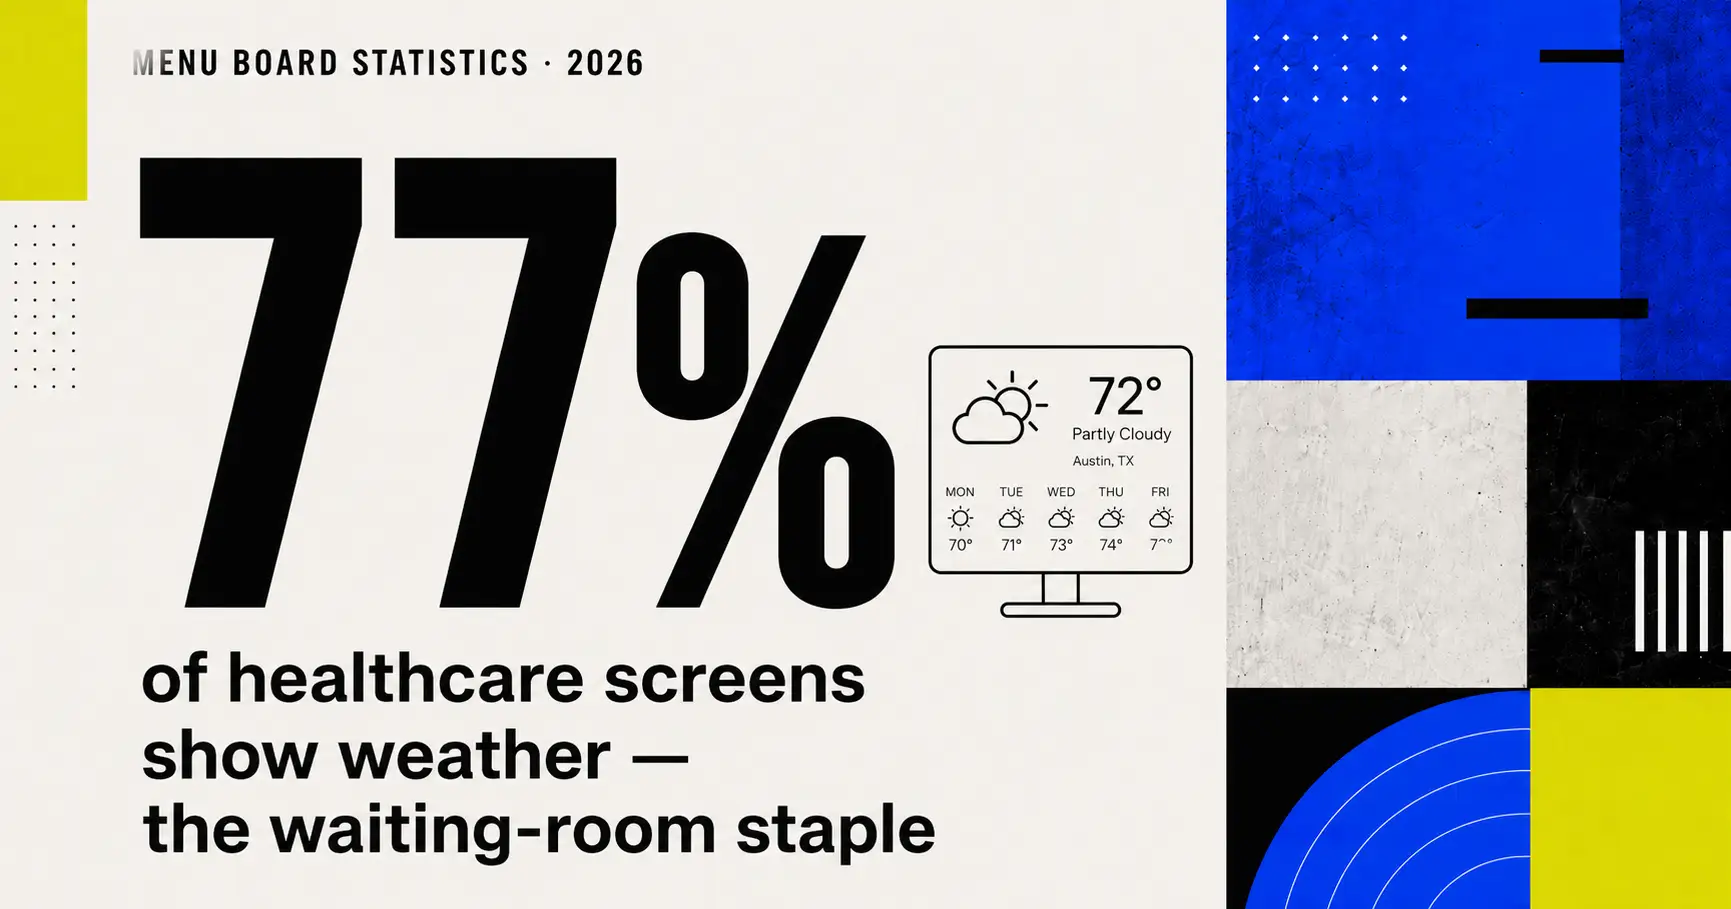
Weather on 77% of healthcare screens, calendars on 48%. Waiting-room content, measured.
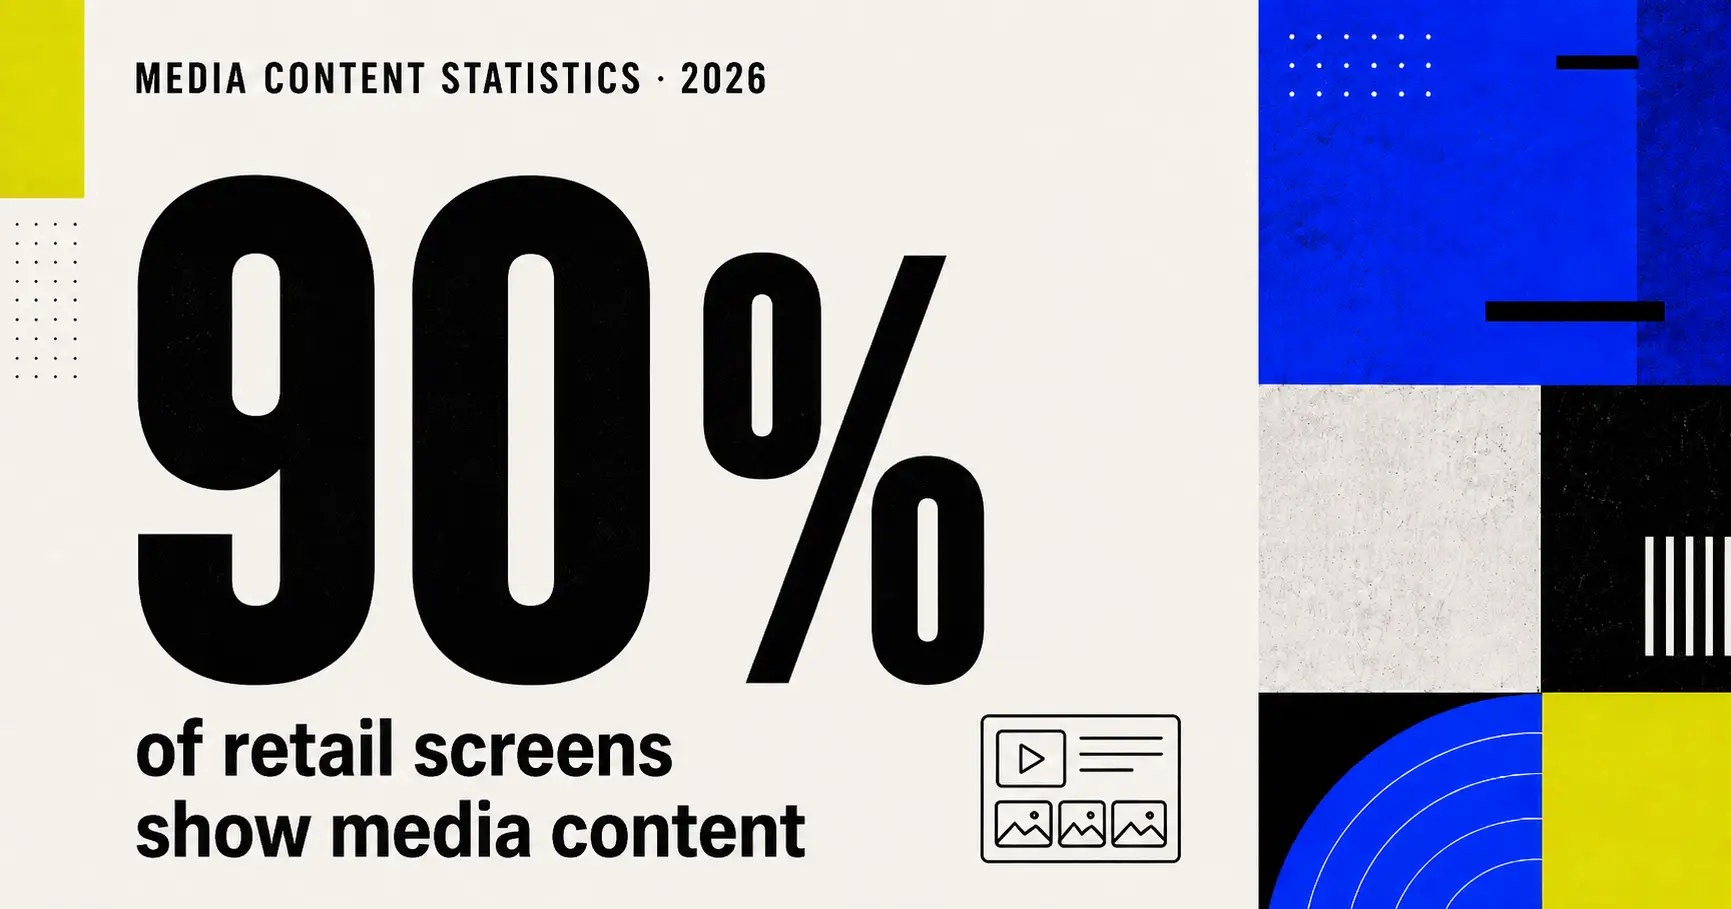
90% of retail screens show media, 68% video. Benchmarks from live retail fleets.
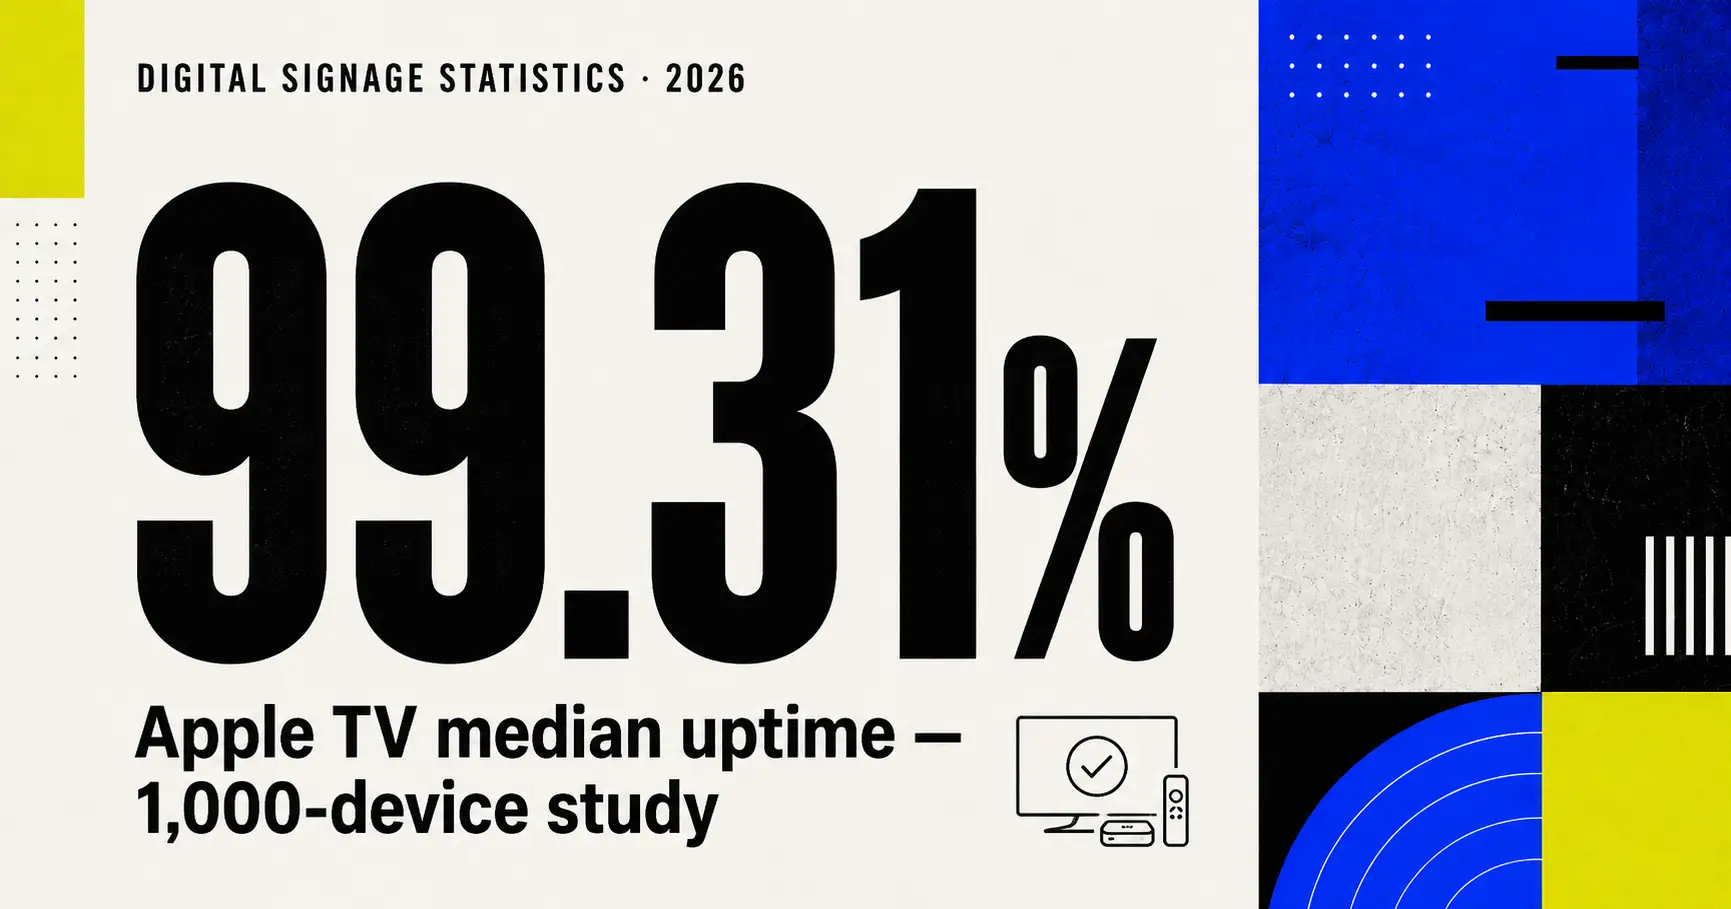
99.31% median uptime over 12 months — the 1,000-device Apple TV reliability study.
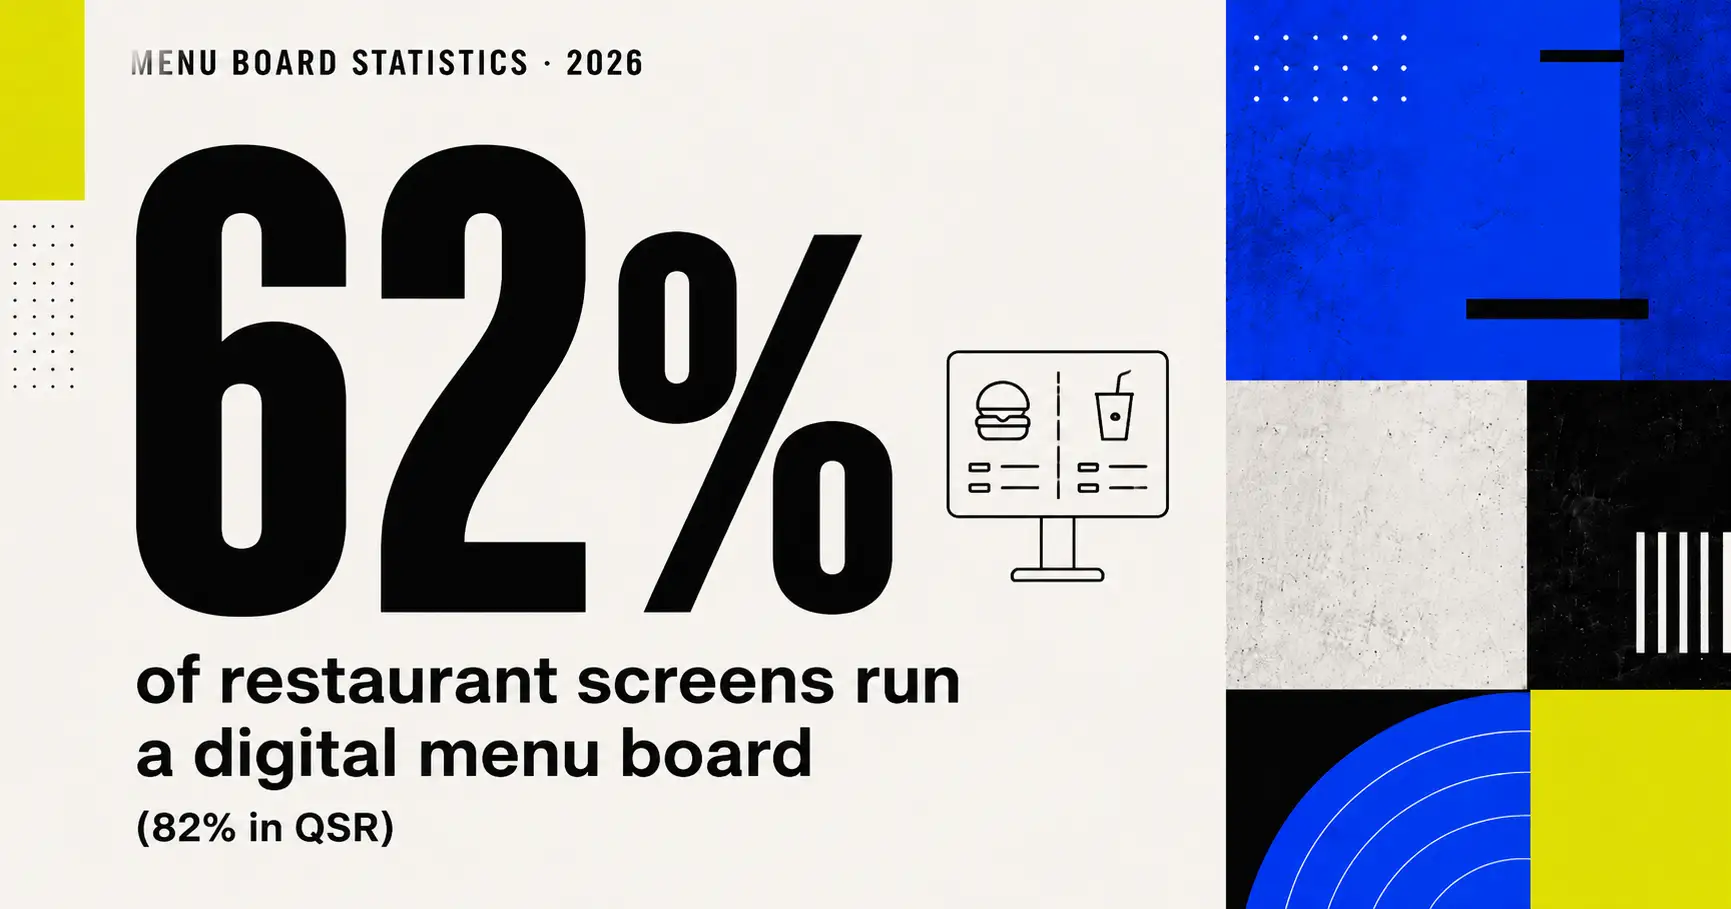
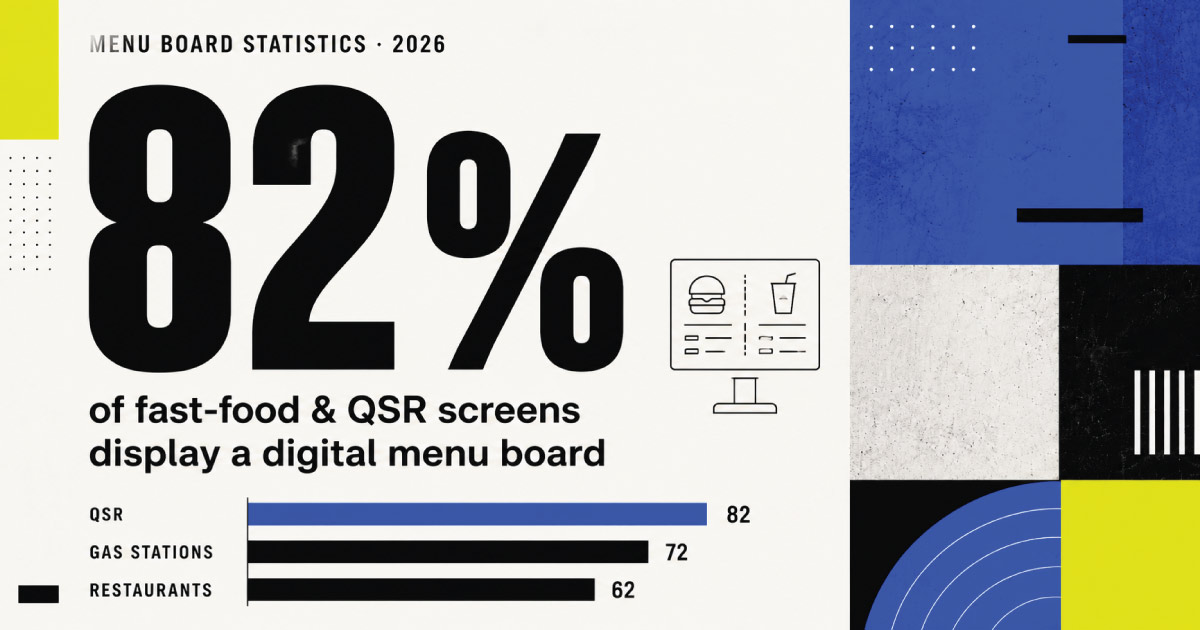
62% of restaurant screens run menu boards — 82% in fast food. Content mix, measured live.
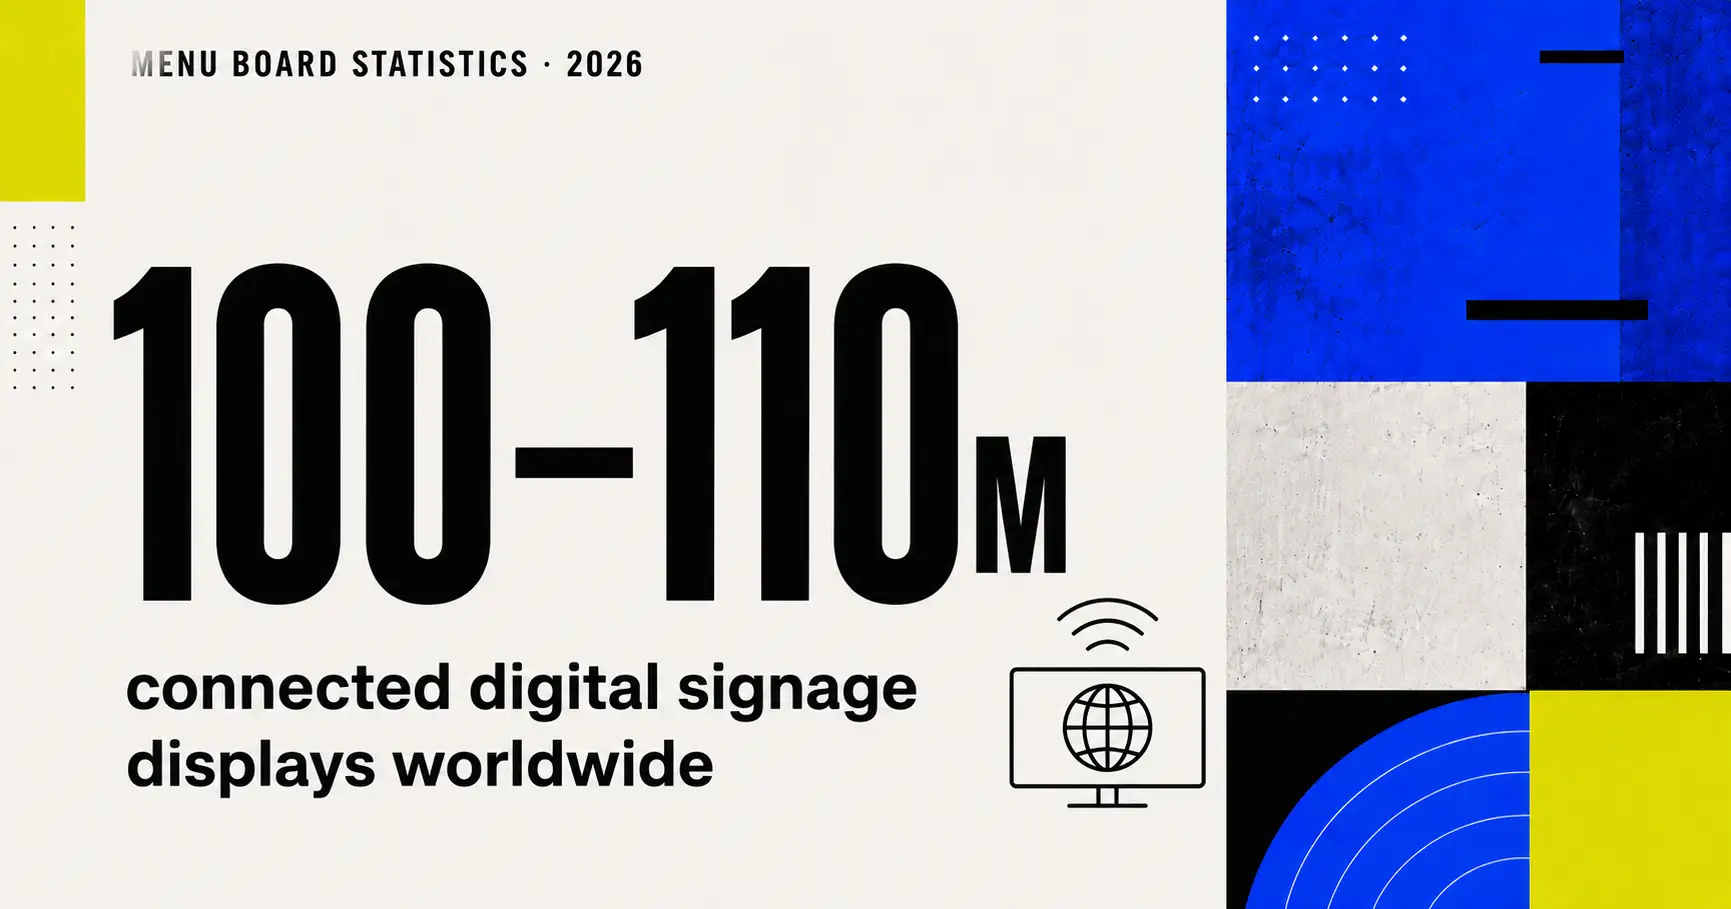
100–110 million connected signage displays worldwide — how we counted, with sources.
How the State of Digital Signage 2026 was measured: sources, metrics, cohorts, and license.
Weather runs on most signage screens — 95% at gas stations. The most universal widget, measured.
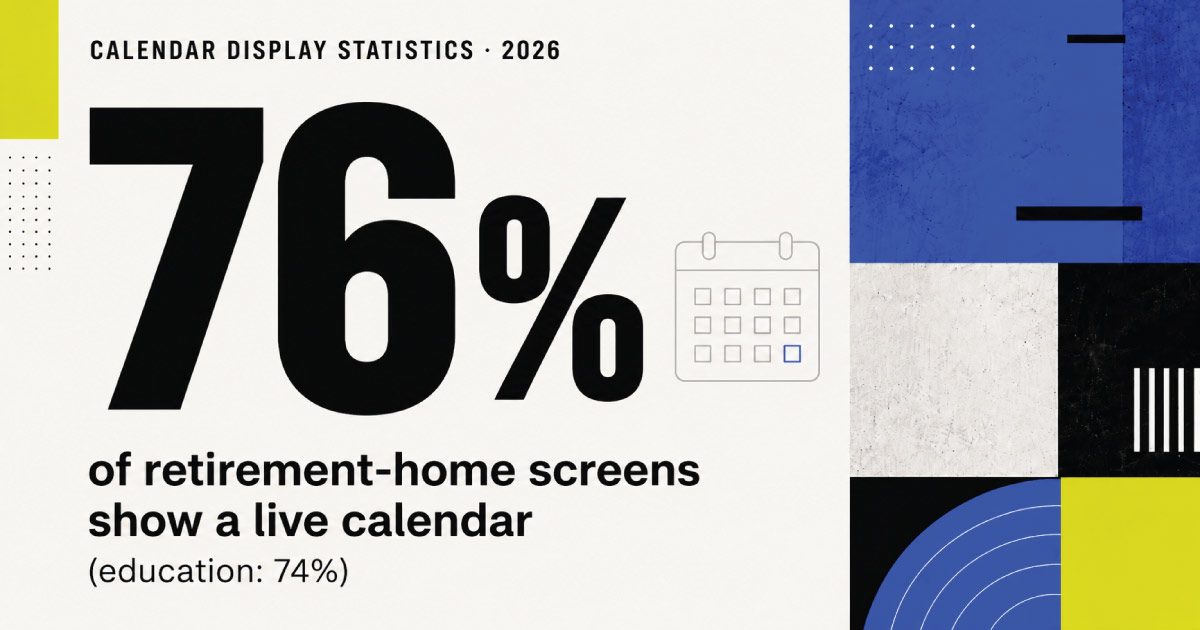
76% of retirement-home and 74% of education screens show a live calendar. Adoption by industry.
82% of QSR screens run a digital menu board. Adoption by industry, measured on 10,000+ screens.
Market size, adoption and fleet benchmarks — every key digital signage statistic for 2026, verified and sourced.