TV dashboard software

TV Dashboard Software for Power BI, Tableau and Live KPIs

A TV dashboard is a screen on the wall that shows live business numbers: sales, support queues, production output or any report your team already builds. Kitcast puts Power BI and Tableau reports, including private ones, and any shareable web dashboard on TVs running Apple TV, Fire TV, Android TV, Samsung, LG or BrightSign, and manages every screen from one place.

No credit card required · Cancel anytime · Works on hardware you already own

★★★★★4.7 on Capterra · 46 reviews
Updated October 2026
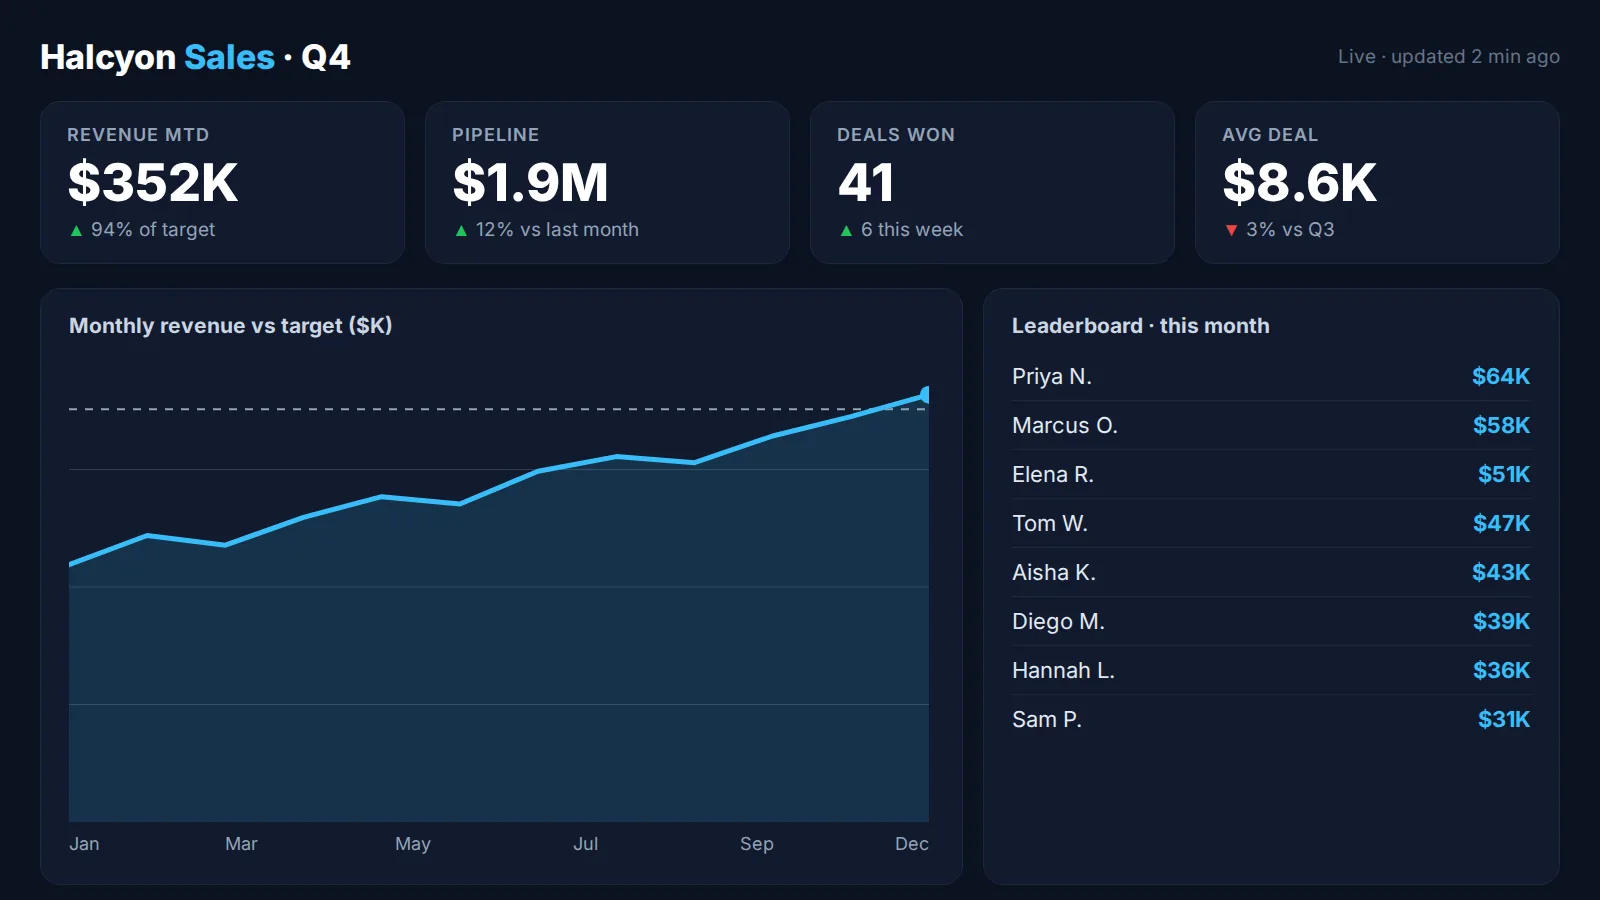
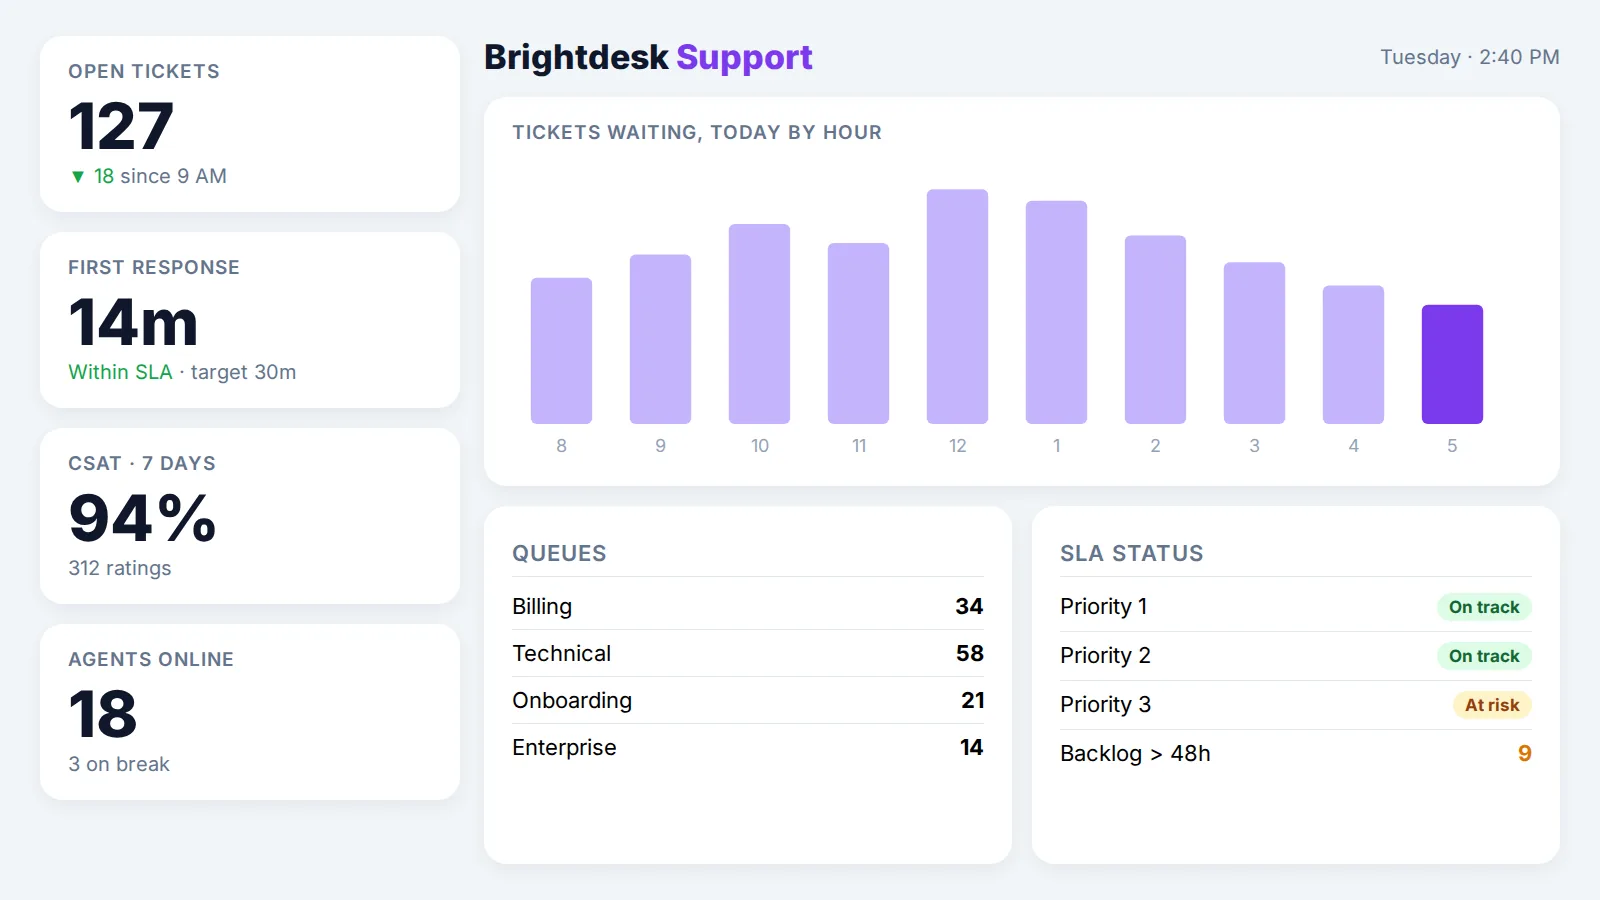
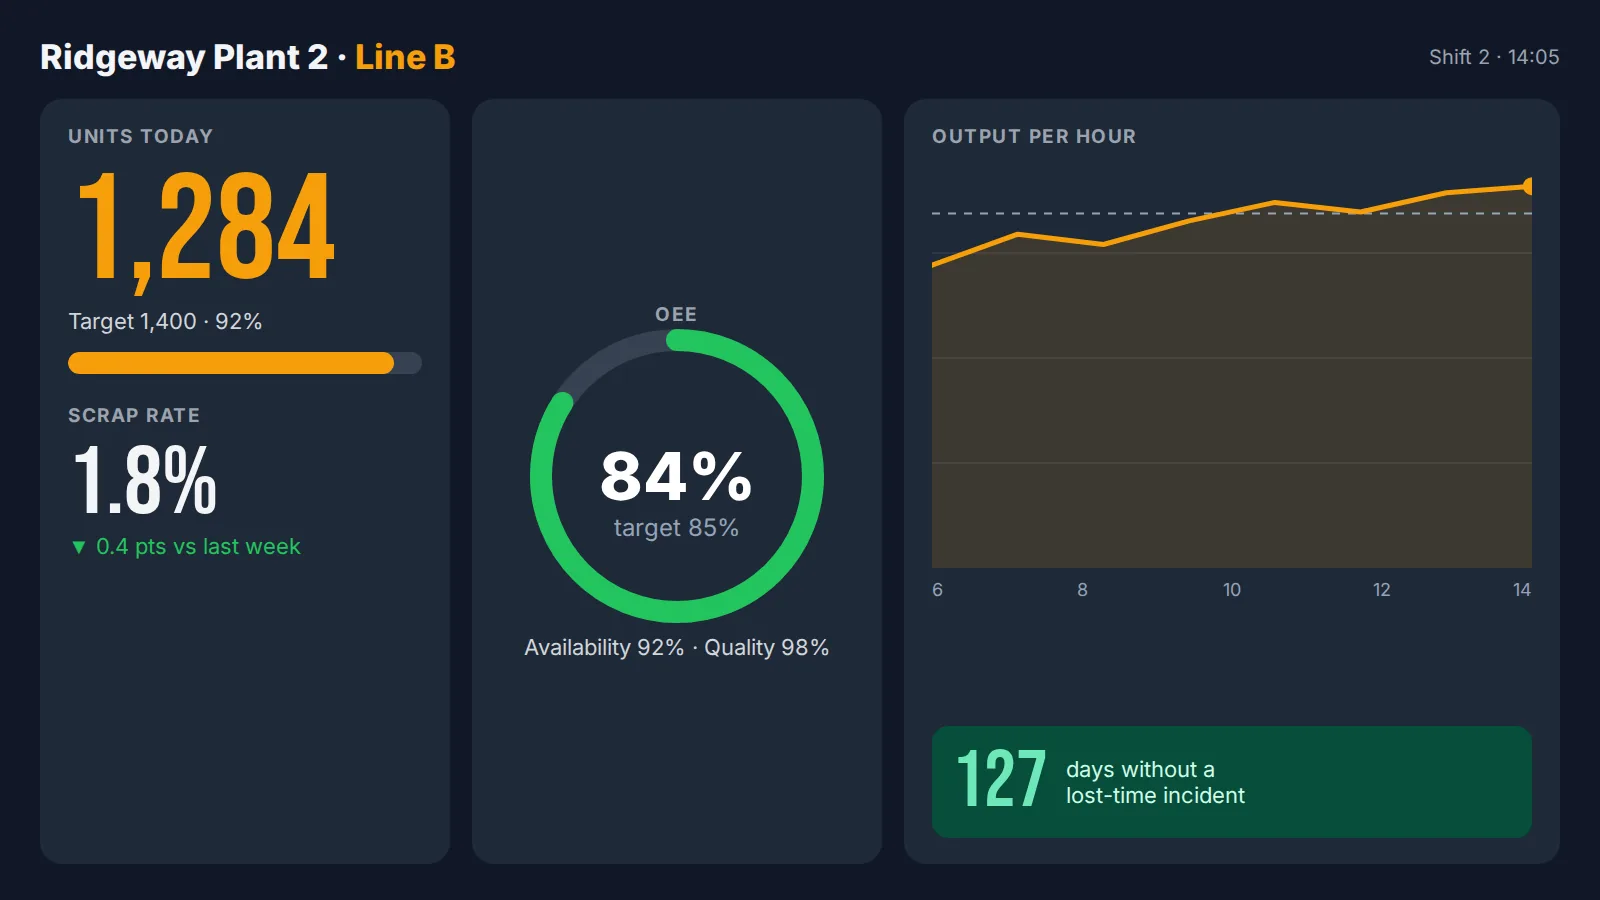
Sales KPI dashboard on an office TV with revenue, pipeline and a monthly trend chartCustomer support dashboard on a TV showing open tickets, response time and SLAProduction line dashboard on a factory TV with output, OEE and days without incident

Example screens: sales floor, support team, production line

In short

  • What it is: a TV or display that shows live KPIs and reports to a team, a floor or a whole company, so nobody has to open a laptop to see the numbers.
  • What you can show: Power BI and Tableau reports, public or private, plus any dashboard that has a public or share-by-link URL, such as Grafana public dashboards or Looker Studio embeds.
  • How it works: connect your Power BI account once with Microsoft sign-in, paste report links, give each page its own slide, and the screen rotates through them. No passwords are stored on the screens.
  • Hardware and price: any HDMI TV with Apple TV, Fire TV, Android TV or BrightSign, or a Samsung or LG smart display. Dashboards are part of the Pro plan: $10 per screen per month billed annually ($14 monthly), with a 14-day free trial.

Definition

What is a TV dashboard?

A TV dashboard, also called dashboard signage or a digital dashboard display, is a wall-mounted screen that shows the same reports your team uses on their laptops, sized for a room. Instead of asking people to open Power BI, the numbers are always in view: on a sales floor, in a support center, next to a production line or in a lobby.

It needs three parts: a screen (any TV with HDMI), a player (Apple TV, Fire TV, Android TV, BrightSign, or the app built into a Samsung or LG display) and software that signs in to your reporting tools, decides which report plays on which screen, and rotates pages on a schedule. The data itself still comes from your BI tool, so the screen is only as fresh as the report behind it.

Data sources

Which dashboards can you show on a TV with Kitcast?

The question that matters for most teams is whether private reports work, because few companies publish their sales numbers to the open web. Here is what Kitcast supports today.

SourcePrivate reportsHow it connects
Microsoft Power BIYesConnect your Power BI account once with Microsoft sign-in, then add any report from your organization by its app.powerbi.com link. Public "Publish to web" reports work too.
TableauYesPrivate views through Tableau's own authorization for embedding. One view per slide.
SigmaYesPrivate dashboards through Sigma's embedding authorization.
Grafana, Looker Studio and other web dashboardsPublic or share-by-link onlyUse a public dashboard, an embed link or a share link in the Website app. Signing in to an arbitrary website from the screen is not supported.
Excel, Google Sheets, PDF reportsFiles you addShow the file with the Document app, from Google Drive, Dropbox, SharePoint or your computer.

Security note: for Power BI, Tableau and Sigma, the screen never receives a password. Anyone who can see the TV can see the report, so put sensitive dashboards only on screens in staff areas, and use roles to control who can change them.

Setup

How do you put a Power BI dashboard on a TV?

Four steps, about as long as it takes to copy a few links. Tableau works the same way, one view per slide.

Connect a player

Plug an Apple TV, Fire TV, Android TV box or BrightSign into the TV, or use a Samsung or LG display with the app built in. Pair it with your Kitcast account using the on-screen code.

Connect Power BI

Sign in once with your Microsoft account in Kitcast. Public reports need no sign-in at all.

Add one slide per page

Paste the app.powerbi.com link for each report page. The link can include the page and filters, so one report can feed several slides, such as one per region.

Set timing and publish

Give each slide a duration, mix in announcements if you like, and publish to one screen or a group. The screen loops through the pages on its own.

Keep the data fresh: dashboards on Kitcast screens refresh automatically, but they show whatever Power BI returns at that moment. Set a scheduled refresh for the dataset in Power BI, or the TV will keep showing yesterday's numbers.

Layouts

What should a TV dashboard look like?

People read a TV dashboard from several meters away, in a few seconds. Three layouts cover most teams.
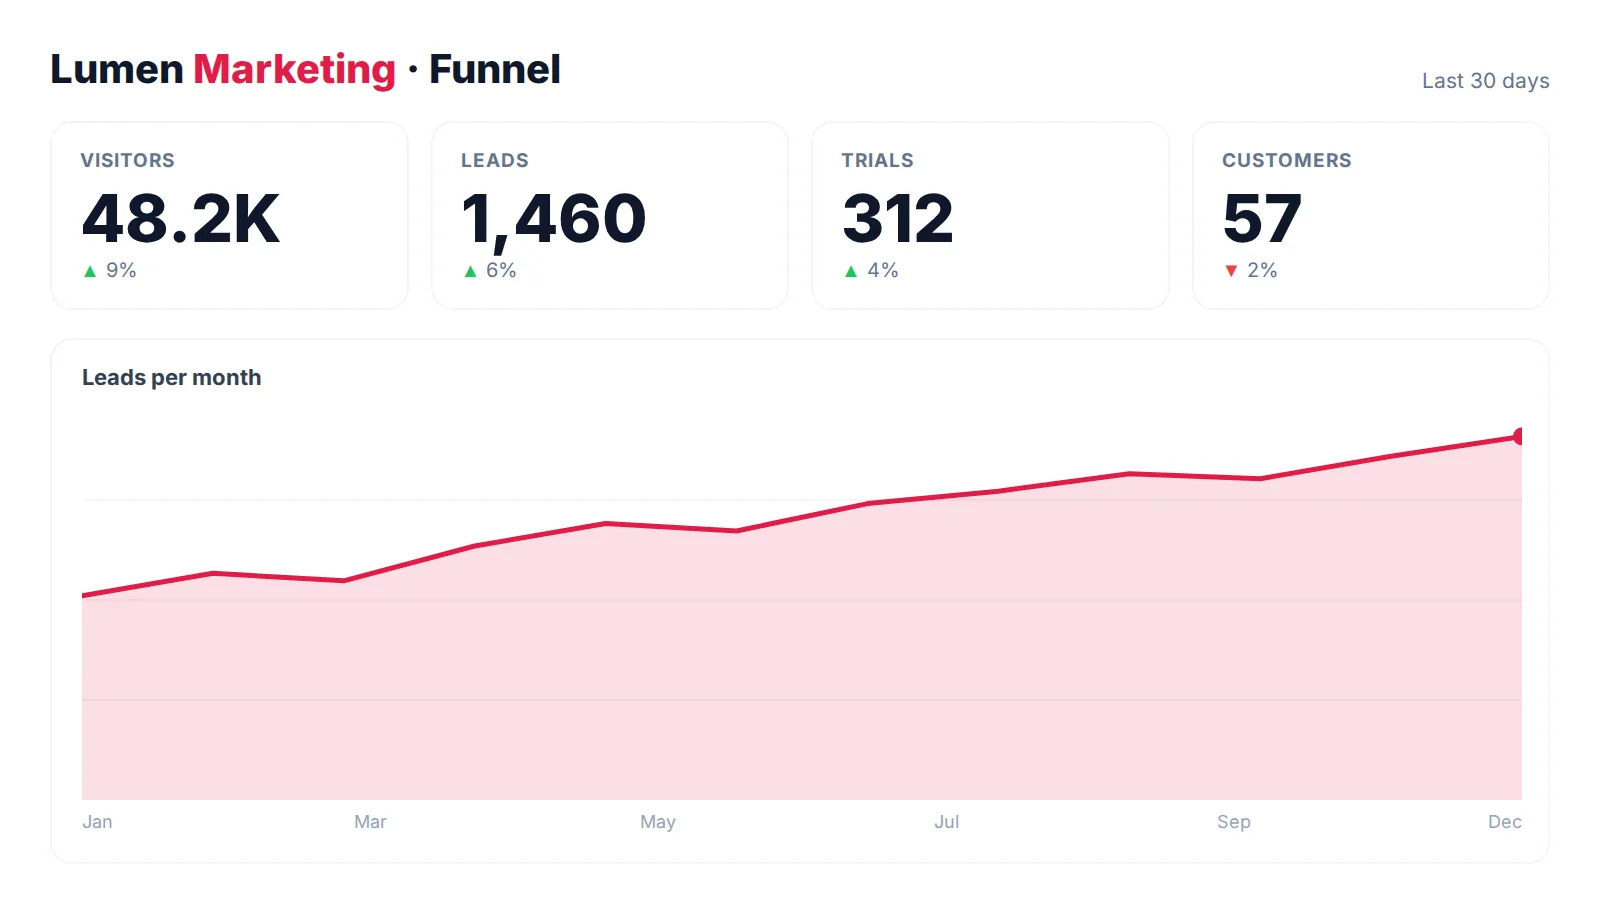
Full-screen marketing funnel dashboard on a TV with four large KPI tiles

One report, full screen

A single dashboard page with four to six numbers that the whole room tracks. Best for sales floors and team areas.
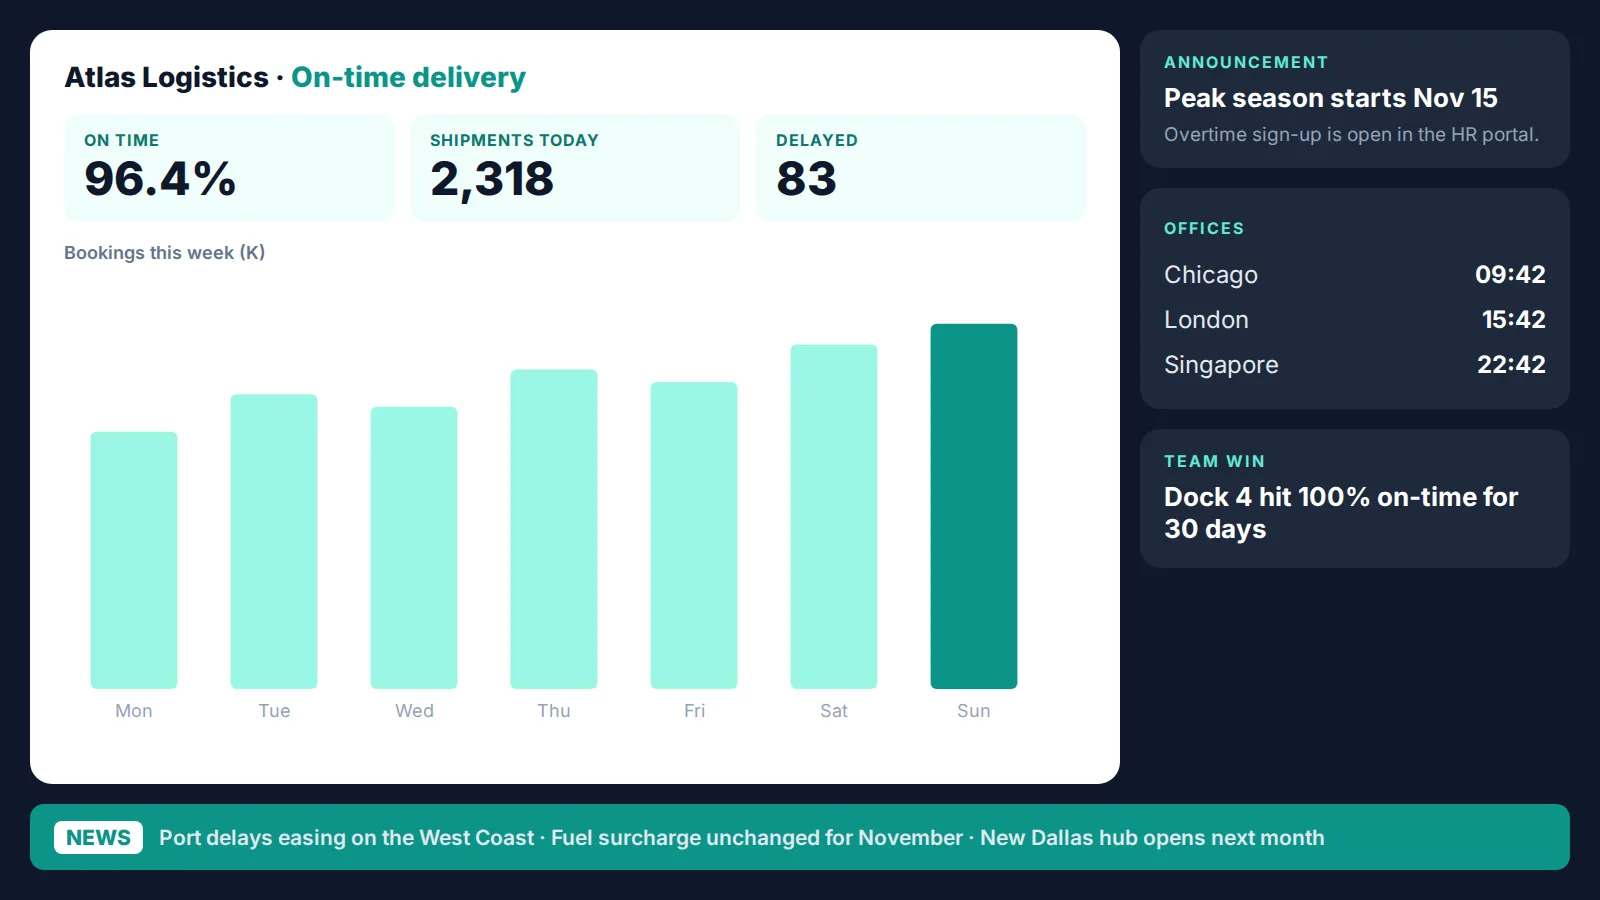
Split-screen TV with a dashboard in the main zone, company announcements, clocks and a news ticker

Dashboard plus context

The report in the main zone, with announcements, world clocks or a ticker around it. Best for offices and lobbies where the screen does more than one job.
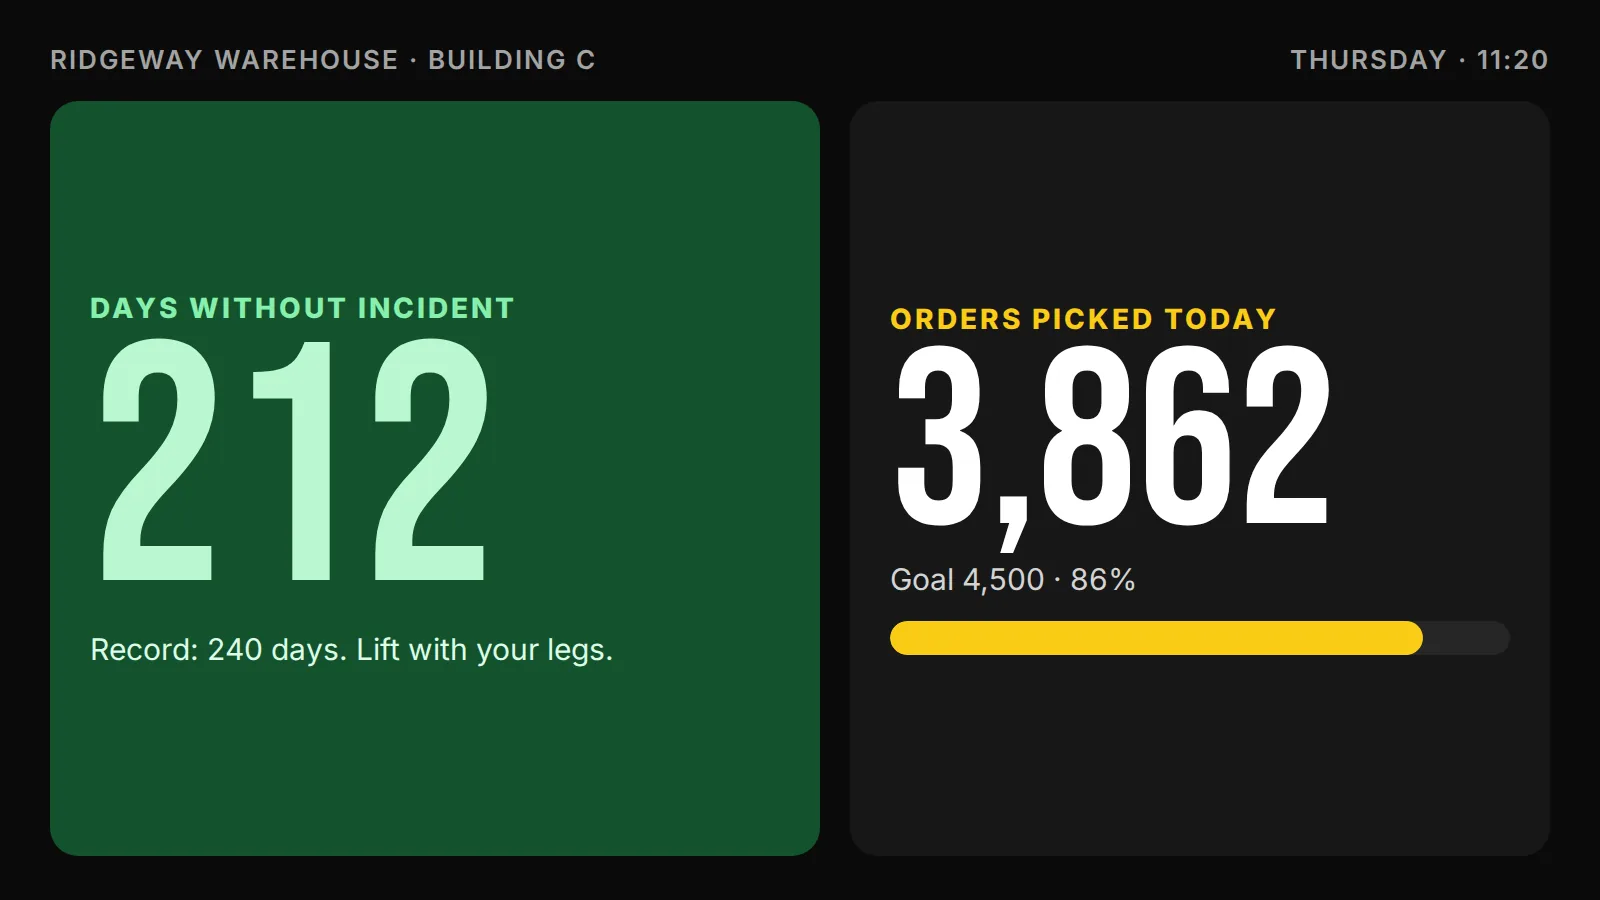
Factory floor scoreboard on a TV showing days without incident and today's output against target

Big-number scoreboard

Two or three numbers in huge type, readable across a warehouse or production hall. Best for safety and output targets.

Design tips

How do you make a dashboard readable on a TV?

A report built for a laptop rarely works on a wall. These changes make the difference, and you make them in Power BI or Tableau, not in Kitcast.

Build a TV page, not a TV report

Add a dedicated 16:9 page with four to six KPIs and large fonts. Keep detailed tables and slicers on the pages people use at their desks.

Show the comparison, not just the number

"$412K" means little on its own. "$412K, 92% of target" or a trend line tells the room whether to worry.

Use filters to split one report

Instead of one crowded page, use page and filter parameters in the link to show one region, team or line per slide, and let the screen rotate.

Time the rotation to the room

Twenty to thirty seconds per slide suits people walking past; a team that watches one number all day may need a single page that never rotates.

Who uses them

Which teams use TV dashboards?

Any team that makes decisions from the same few numbers every day. Kitcast customers include Marriott, The New York Times, McLaren and Delta Dental.

Sales teams

Revenue against target, pipeline by stage and the leaderboard, on the sales floor and in the manager's office.

Corporate communications →

Customer support

Open tickets, wait times and SLA status, so the team sees a queue building before customers feel it.

Internal communications →

Manufacturing

Output against plan, OEE, scrap and days without a safety incident, next to the line.

Manufacturing digital signage →

Warehouses and logistics

Orders picked, shipments due and dock status, in big numbers that read across the floor.

Logistics digital signage →

IT and operations

System status from a Grafana public dashboard or status page, alongside incident announcements.

Website app →

Leadership and lobbies

Company-wide KPIs, goals and milestones in shared spaces, mixed with news and announcements.

Digital bulletin boards →

Compare

Laptop on HDMI, smart TV browser or dashboard software?

Most TV dashboards start as a spare laptop plugged into a TV. It works until the laptop sleeps, the session expires or someone needs the screen in another building.

Laptop or PC on HDMISmart TV browserKitcast
Private Power BI and Tableau reportsYes, with a user signed in on that machineOften blocked by sign-in or browser limitsYes, through one account connection; no passwords on screens
Several pages or reportsManual, or an add-on to rotate tabsManualOne slide per page, rotating on a schedule
Other content on the screenNoNoZones and playlists with announcements, clocks and news
Many screens and sitesOne machine per screen, managed by handEach TV set up by handOne dashboard; group screens by team, floor or building
Knowing a screen is downSomeone noticesSomeone noticesOnline and offline status for every screen; alerts on Pro
HardwareA computer per screenThe TVApple TV, Fire TV, Android TV, BrightSign, or a Samsung or LG display

Rule of thumb: one screen in one meeting room can live with a laptop. Once dashboards run all day, on more than one screen, or share the screen with other content, use signage software. Comparing vendors? See our digital signage software comparison.

Hardware & pricing

What hardware and plan do you need for TV dashboards?

Any screen with an HDMI input plus a supported player, or a smart display with Kitcast built in. A 4K TV helps when a dashboard has small text.

Apple TVAndroid TVAmazon Fire TVBrightSignSamsung TizenLG webOSmacOSiOS / iPadOSWeb player

Starter

$7 /screen/mo

Billed annually · $9 billed monthly

Playlists, scheduling, zones, documents and spreadsheets as files, calendars, news and weather. Does not include Power BI, Tableau or web page dashboards.

Pro

$10 /screen/mo

Billed annually · $14 billed monthly

Everything in Starter plus dashboards (Power BI, Tableau and more), web pages and live streams, advanced roles, SSO (SAML), API, monitoring alerts, MDM and audit logs.

Enterprise

Custom

For large rollouts

Assigned customer success manager, support SLAs, guided onboarding and custom terms.

Every plan starts with a 14-day free trial, no credit card required. Compare all plan features →

FAQ

TV dashboard questions

What is a TV dashboard?

A TV dashboard is a wall-mounted screen that shows live business data, such as sales, support queues or production output, to everyone in a room. It usually displays reports from a BI tool like Power BI or Tableau, managed by digital signage software that decides which report plays on which screen and rotates through pages on a schedule.

Can I show a Power BI dashboard on a TV?

Yes. In Kitcast, connect your Power BI account once with Microsoft sign-in, then add any report from your organization by its app.powerbi.com link. Public Publish to web reports work without signing in. Each report page is its own slide, and the link can include the page and filters. Power BI dashboards are part of the Kitcast Pro plan.

Do private Power BI and Tableau reports work?

Yes. Private Power BI reports work after a one-time Microsoft sign-in, and private Tableau and Sigma dashboards work through their own authorization for embedding. No passwords are stored on the screens. Other web dashboards that require a login, such as Grafana, Salesforce or Jira, need a public or share-by-link version.

Does the dashboard update automatically?

Yes. Dashboards on Kitcast screens refresh automatically without anyone reloading the screen. They show the data your BI tool returns at that moment, so set a scheduled dataset refresh in Power BI or Tableau to keep the numbers current.

Can one screen show several dashboard pages?

Yes. Add each report page or Tableau view as its own slide, give each slide a duration, and the screen loops through them. You can also split the screen into zones to show a dashboard next to announcements, clocks or a news ticker.

Can I show Grafana, Looker Studio or other dashboards?

Yes, if the dashboard has a public or share-by-link URL, such as a Grafana public dashboard or a Looker Studio embed link. Add it with the Website app. Kitcast cannot sign in to arbitrary websites from the screen.

What hardware do I need for a TV dashboard?

Any TV with an HDMI input and a supported player: Apple TV, Amazon Fire TV, Android TV or BrightSign. Samsung and LG smart displays can run Kitcast without an extra box. A 4K screen helps when dashboards have small text.

How much does TV dashboard software cost?

Power BI, Tableau and web page dashboards are part of the Kitcast Pro plan: $10 per screen per month billed annually or $14 billed monthly. The Starter plan ($7 annually, $9 monthly) covers documents, calendars and other content but not dashboards. Every plan starts with a 14-day free trial without a credit card.

Is it safe to show company data on a TV?

Kitcast does not store passwords on the screens, and Pro adds roles, SSO and audit logs to control who can change what plays. The main risk is physical: anyone who can see the TV can read it, so place screens with sensitive numbers in staff-only areas.

Put your numbers where the team can see them

Connect Power BI or Tableau, add your report pages and publish to every screen from one dashboard.

No credit card · Cancel anytime · 14 days free